So what exactly is it??? The name in itself implies something ✨groundbreaking✨, ✨mind blowing✨, and may I even say cool. 😎
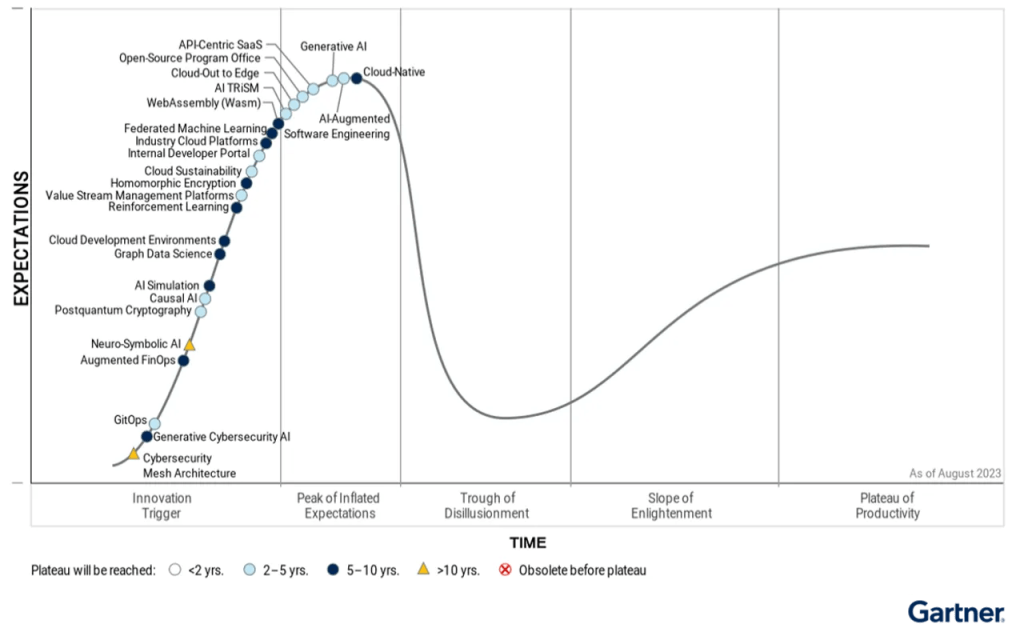
So what is it? It’s a chart showing the hype stage that major technological advances are in. It’ll chart out new stuff like Generative AI and reinforcement learning. All new breakthroughs in a constantly changing field.
We can see the various stages aptly (more like somewhat dramatically) named peak of inflated expectations and trough of disillusionment. This chart, published by the research firm, Gartner, really neatly charts expectations for various ideas on this chart.
Now if I was to chart autonomous cars as an 11 year old on this chart, you could put my expectations right at the peak of inflated expectations. Find the maximum value on that curve, stretch it upward just a tad bit. In fact, I’d even been quoted at school saying that I didn’t think I’d need a license, after all there’d be self driving cars. 🤯
As I grow older, and gain a more nuanced perspective on the challenges needed to overcome to achieve this dream into a reality, such as consistent and accurate AI models, I’m being pushed towards the trough of disillusionment. But don’t take this to say I don’t believe that we can do it. Thanks to growing robotics education and a focus on smart learning, this goal really is manageable, I think. I have hope.
Anywho, that’s a little off topic, but basically the Hype-cycle is an extremely interesting chart of expectations, and with the way we’re progressing, I think reality will match up pretty well to what we want.
I am yet to learn about many of the topics on this hype-curve, but it sounds like today’s hype may very well be tomorrow’s reality.

Leave a comment